Pyramid's decision intelligence platform, with PYRANA, the most powerful direct query engine at the core, uniquely combines data prep, business analytics and data science into a unified decision-making experience, making it easy to scale to any data, any person and any analytics needs from the simple to the sophisticated with reliability, data governance and security.

Download Your Personal
Copy of the eBook

Insights for everyone cover-1


Fill out the form to receive your copy of the eBook.

Download the eBook

What Makes Pyramid so Powerful?

direct-access-to-data


Deliver Direct Access to Any Data

Don’t delay insights because IT has to move data. Use PYRANA—our powerful direct query engine at the heart of our platform—to instantly connect to any data source directly, query and blend any amount of data at scale, with data governance and security built in.

managed-access-for-any-person


Enable Managed Access for Any Person

Reduce the backlog of requests. Deliver tailored access to insights to the people who need it to answer questions and take action. Provide one-click explanations of your business so your c-suite can answer the question, now what?

serve-any-analytics-need


Serve Any Analytics Needs

Meet requests for capabilities from the simple to sophisticated. With a no-code, point-and click experience, anyone from a data novice to a data scientist can be self-sufficient. Simplify the analytics pipeline and the sophisticated work needed to get deeper insights across the analytics spectrum.

pyramid-model-icon

Model

Prepare data, deploy machine learning, and build data models. 

  • End-user one-click or advanced modeling from numerous data sources
  • Machine learning algorithms and marketplaces during data preparation
  • Flexible data-model deployment: ANSI-SQL, SSAS, or native in-memory

pyramid-discover-icon

Discover

Interact with data models and make new data discoveries.

  • Fast query processing for large data sets
  • Intuitive drag-and-drop capabilities
  • Attractive visualizations
  • Powerful, single-click statistical analysis
  • AI-guided and advanced analytics
  • Real-time, interactive collaboration
  • Natural language queries (NLP)

pyramid-present-icon

Present

Design presentations and analytic applications with your content. 

  • Create “on the fly” guided dashboards with interactive analysis in seconds
  • Browser or Mobile page support
  • Option to design custom, responsive mobile-specific layouts
  • Combine multiple queries and data sources
  • Dynamic navigation elements, including cross-drill for flexible and extendable analytics

pyramid-publish-icon

Publish

Build publications and reports to tell compelling analytic stories.

  • Pixel-perfect report creation
  • Drag-and-drop layout control for views, images, and text
  • Master page support for high-quality templates
  • High capacity, automated report scheduling and dynamic distribution
  • Dynamic reporting with governed secure access

pyramid-formulate-icon

Formulate

Define and reuse calculations, KPIs, and scripts.

  • Drag-and-drop creation of logic, advanced parameters, KPIs, and custom script
  • Shared business logic as a first-class citizen
  • Dynamic sets with branching logic
  • Out-of-the-box aggregates, operators, and functions

pyramid-illustrate-icon

Illustrate

Create data-driven graphics, text, and visual elements.

  • Model workflows with compelling infographics
  • Share and reuse content across presentations and publications
  • Compose dynamic text that changes with data
  • Use data to alter images and provide greater context

pyramid-administer-icon

Administer

Control every aspect of your analytics environment. 

  • Free content management and lineage analysis
  • Manage data sources
  • Easily provision users, roles, and profiles
  • Optimize large query performance
  • Track user consumption and engagement
  • Configure universal visual themes
  • Scale up and out in a multi-tenancy environment

pyramid-cms-icon

CMS

Access analytic content from a centralized location.

  • Access personal, group, or public content
  • in familiar folder interface
  • View favorite, most used, and
  • recommended content
  • Use search and filter to find content
  • View metadata, lineage, and versioning

Who Uses Pyramid?

insights for everyone

Peripheral Recipients

(Non-Pyramid or Disconnected Users) Non-Pyramid or disconnected users can receive automated static
content with dynamic natural language generation output in PDF, PowerPoint, Word and other formats, driven through an auto-scheduling and auto-distribution capability to easily share regular reports without additional user intervention.

Casual or Embedded External Application Viewers

Casual users get guided access to simplified and interactive reports and Dashboards with content selection features. Our embedded analytics integrates powerful BI capabilities directly within your custom applications and user portals. Deliver powerful, self-service analytics solutions that are easy to customize, integrate and deploy, getting your solution to market faster while you stay focused on your business skills with your customers and partners.

Active Viewers

Active Viewers get structured, organized and interactive reports and dashboards in Pyramid. Pyramid offers
valuable features like interactive commentary, alerts, and AI-driven guided analysis for simplified report and
dashboard generation.

Data Workers

Proficient analysts can use or build interactive content across the entire platform, including calculations,
data mash-ups, presentations and publications which can then be shared across the organization by simply dragging and dropping content for immediate consumption across the entire user community, whether via browser or a mobile device.

Data Scientists

In addition to information workers, Data Scientists can build complex scripts and models (R, Python), create
advanced data models and use advanced analytic functions to deliver sophisticated analytics easily and
at speed to other users.

BI Developers and Administrators

Access to the entire suite to manage, govern and control, with the rights to create and share content securely with non-technical users. Also, develop and maintain publications, embedded content in external application and support the overall system across any size user community simply and easily.

Download Your Personal
Copy of the eBook

Insights for everyone cover-1

Fill out the form to receive your copy of the eBook.

Download the eBook

KASH Tech’s Vendor-Agnostic Approach

At KASH Tech, we believe in taking a vendor-agnostic approach to building our client's data and analytics strategies. Rather than focusing on selling a specific software or platform, we approach data and analytics strategies holistically. This means we will evaluate your business's unique needs to advise on the best tool or platform for your specific needs and audience.

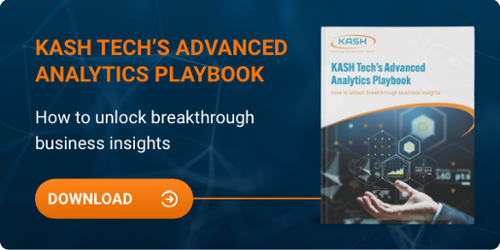
We follow a systematic approach to addressing the requirements of our clients when it comes to digital transformation challenges by employing a four-phase process that ensures each client receives a custom solution that is tailored-fit to their unique configuration.

The methodology involves a thorough analysis that provides a comprehensive strategy for successful implementation. If you want to learn how to unlock advanced business intelligence, eliminate data silos, and create actionable business insights, download KASH Tech's Advanced Analytics Playbook eBook for free. It's a valuable resource for organizations who want to achieve breakthrough business insights.


If you’re ready to explore solutions, request a data and analytics discovery call from the KASH Tech team.

kash-tech-advanced-playbook-how-to-unlock-breakthrough-business-insights